Reports
In the Reports section of the dashboard, you will find two types of reports. The Credit Operation Overview presents an analysis of the products and offers issuance. The Portfolio Summary presents detailed information regarding each Aggregator and the offers available for them.
Credit Operation Overview
The Credit Operation Overview report offers an in-depth analysis of the issuance of each product and offer. It includes detailed information and charts to help you understand the data effectively. A specific date range can filter the report and will provide a comparison to the same time span with your selected starting date as the end date. The following are the detailed fields you will find in the report:
| Metric | Description |
|---|---|
| Total Loans | The total number of loans issued during the defined period. |
| Active Customers | The number of customers with outstanding loans during the defined period. |
| Total Disbursed | The total amount of money loaned out during the defined period. |
| Average Disbursed | The average loan amount per customer. (Calculated as Total Disbursed / Active Customers) |
| Total Collected | The total amount of money paid back by customers during the defined period. |
| Revenue | The percentage of Total Disbursed that represents income for the lender. |
| Collected | The percentage of Total Disbursed that has been repaid by customers. |
| Bad Debt | The percentage of Total Disbursed that is considered unrecoverable and written off as a loss. |
Bad debt
A credit is deemed bad when it remains unpaid for more than 90 days.
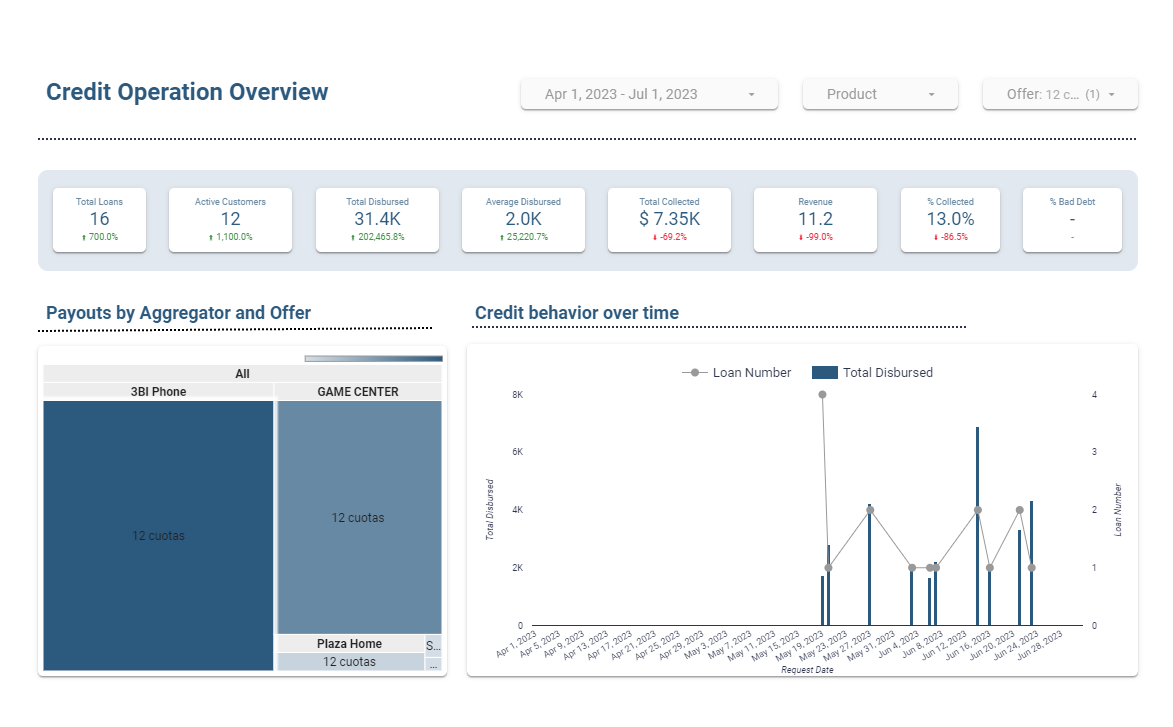
The image below is an example of the Credit Operation Overview report:
Portfolio Summary
The Portfolio Summary report will show you detailed information regarding each of your Aggregators, filtered by one of their available offers. A specific date range can filter the report and will provide a comparison to the same time span with your selected starting date as the end date. The following are the detailed fields you will find in the report:
| Metric | Description |
|---|---|
| Total Disbursed | The total amount of money loaned out during a specific period. |
| Capital in Balance | The outstanding balance of all loans that have not yet been fully paid back. |
| Balance On Time | The portion of Capital in Balance that is currently being repaid according to the agreed schedule. |
| Balance At Risk | The portion of Capital in Balance that is considered at risk of default due to late payments or other factors. Unpaid for more than 60 days and less than 90 days. |
| Bad Debt Balance | The portion of Capital in Balance that has been written off as unrecoverable due to default or other losses. Unpaid for more than 90 days. |
This report also presents a table, at the bottom of the screen, with detailed information based on loan health states, along with a clickable pie chart, on the right, to filter by each of the following states:
- Healthy Loan: A loan that is being repaid on time and in full according to the agreed-upon schedule.
- Cancelled Loan: A loan that has been terminated before full repayment, usually before disbursement or early on in the repayment schedule.
- Paid Loan: A loan that has been successfully repaid in full by the borrower.
- At Risk Loan: A loan that is due for more than 60 days, and less than 90.
- Bad Debt Loan: A loan that is due for more than 90 days.
The image below exemplifies the report view:

Updated 11 months ago